Preparation
We start by loading the beta dispersion data generated in script 5 for the whole and core microbiomes, respectively.
data.all <- read.csv("tables/p5/boxplot_dispersion_data_whole_jjs.csv",
                   row.names = NULL, header = T, sep = ",")
data.all.core <- read.csv("tables/p5/boxplot_dispersion_data_core_NEW2_jjs.csv",
                        row.names = NULL, header = T, sep = ",")

data.all$Reef <- factor(data.all$Reef, levels = c('SCR', 'PPR', 'CCR',
                                                  'ALR', 'SIS', 'ROL',
                                                  'RNW', 'PST','PBL'))
data.all.core$Reef <- factor(data.all.core$Reef, levels = c('SCR', 'PPR',
                                                            'CCR', 'ALR',
                                                            'SIS', 'ROL',
                                                            'RNW', 'PST',
                                                            'PBL'))
Then we set some plot themes.
level_order3 <- c('SCR', 'PPR', 'CCR', 'ALR', 'SIS', 'ROL', 'RNW', 'PST','PBL')
level_order <- c('Outer bay', 'Inner bay', 'Inner bay disturbed')
level_order2 <- c('Jaccard', 'Modified Gower', 'Bray Curtis', 'Unifrac',
                  'Generalized Unifrac', 'Weighted Unifrac')
disp.pal4 <- c("royalblue4", "royalblue3", "royalblue1",
"aquamarine4", "mediumaquamarine", "aquamarine2",
"chocolate3", "chocolate2", "sienna1")
disp.pal5 <- c("midnightblue", "royalblue4", "royalblue3","darkslategrey",
"aquamarine4", "mediumaquamarine", "chocolate4", "sienna",
"chocolate3")font_theme = theme(
axis.title.x = element_text(size = 14),
axis.text.x = element_text(size = 10),
axis.title.y = element_text(size = 14),
axis.text.y = element_text(size = 8))Generate Plots
Whole community
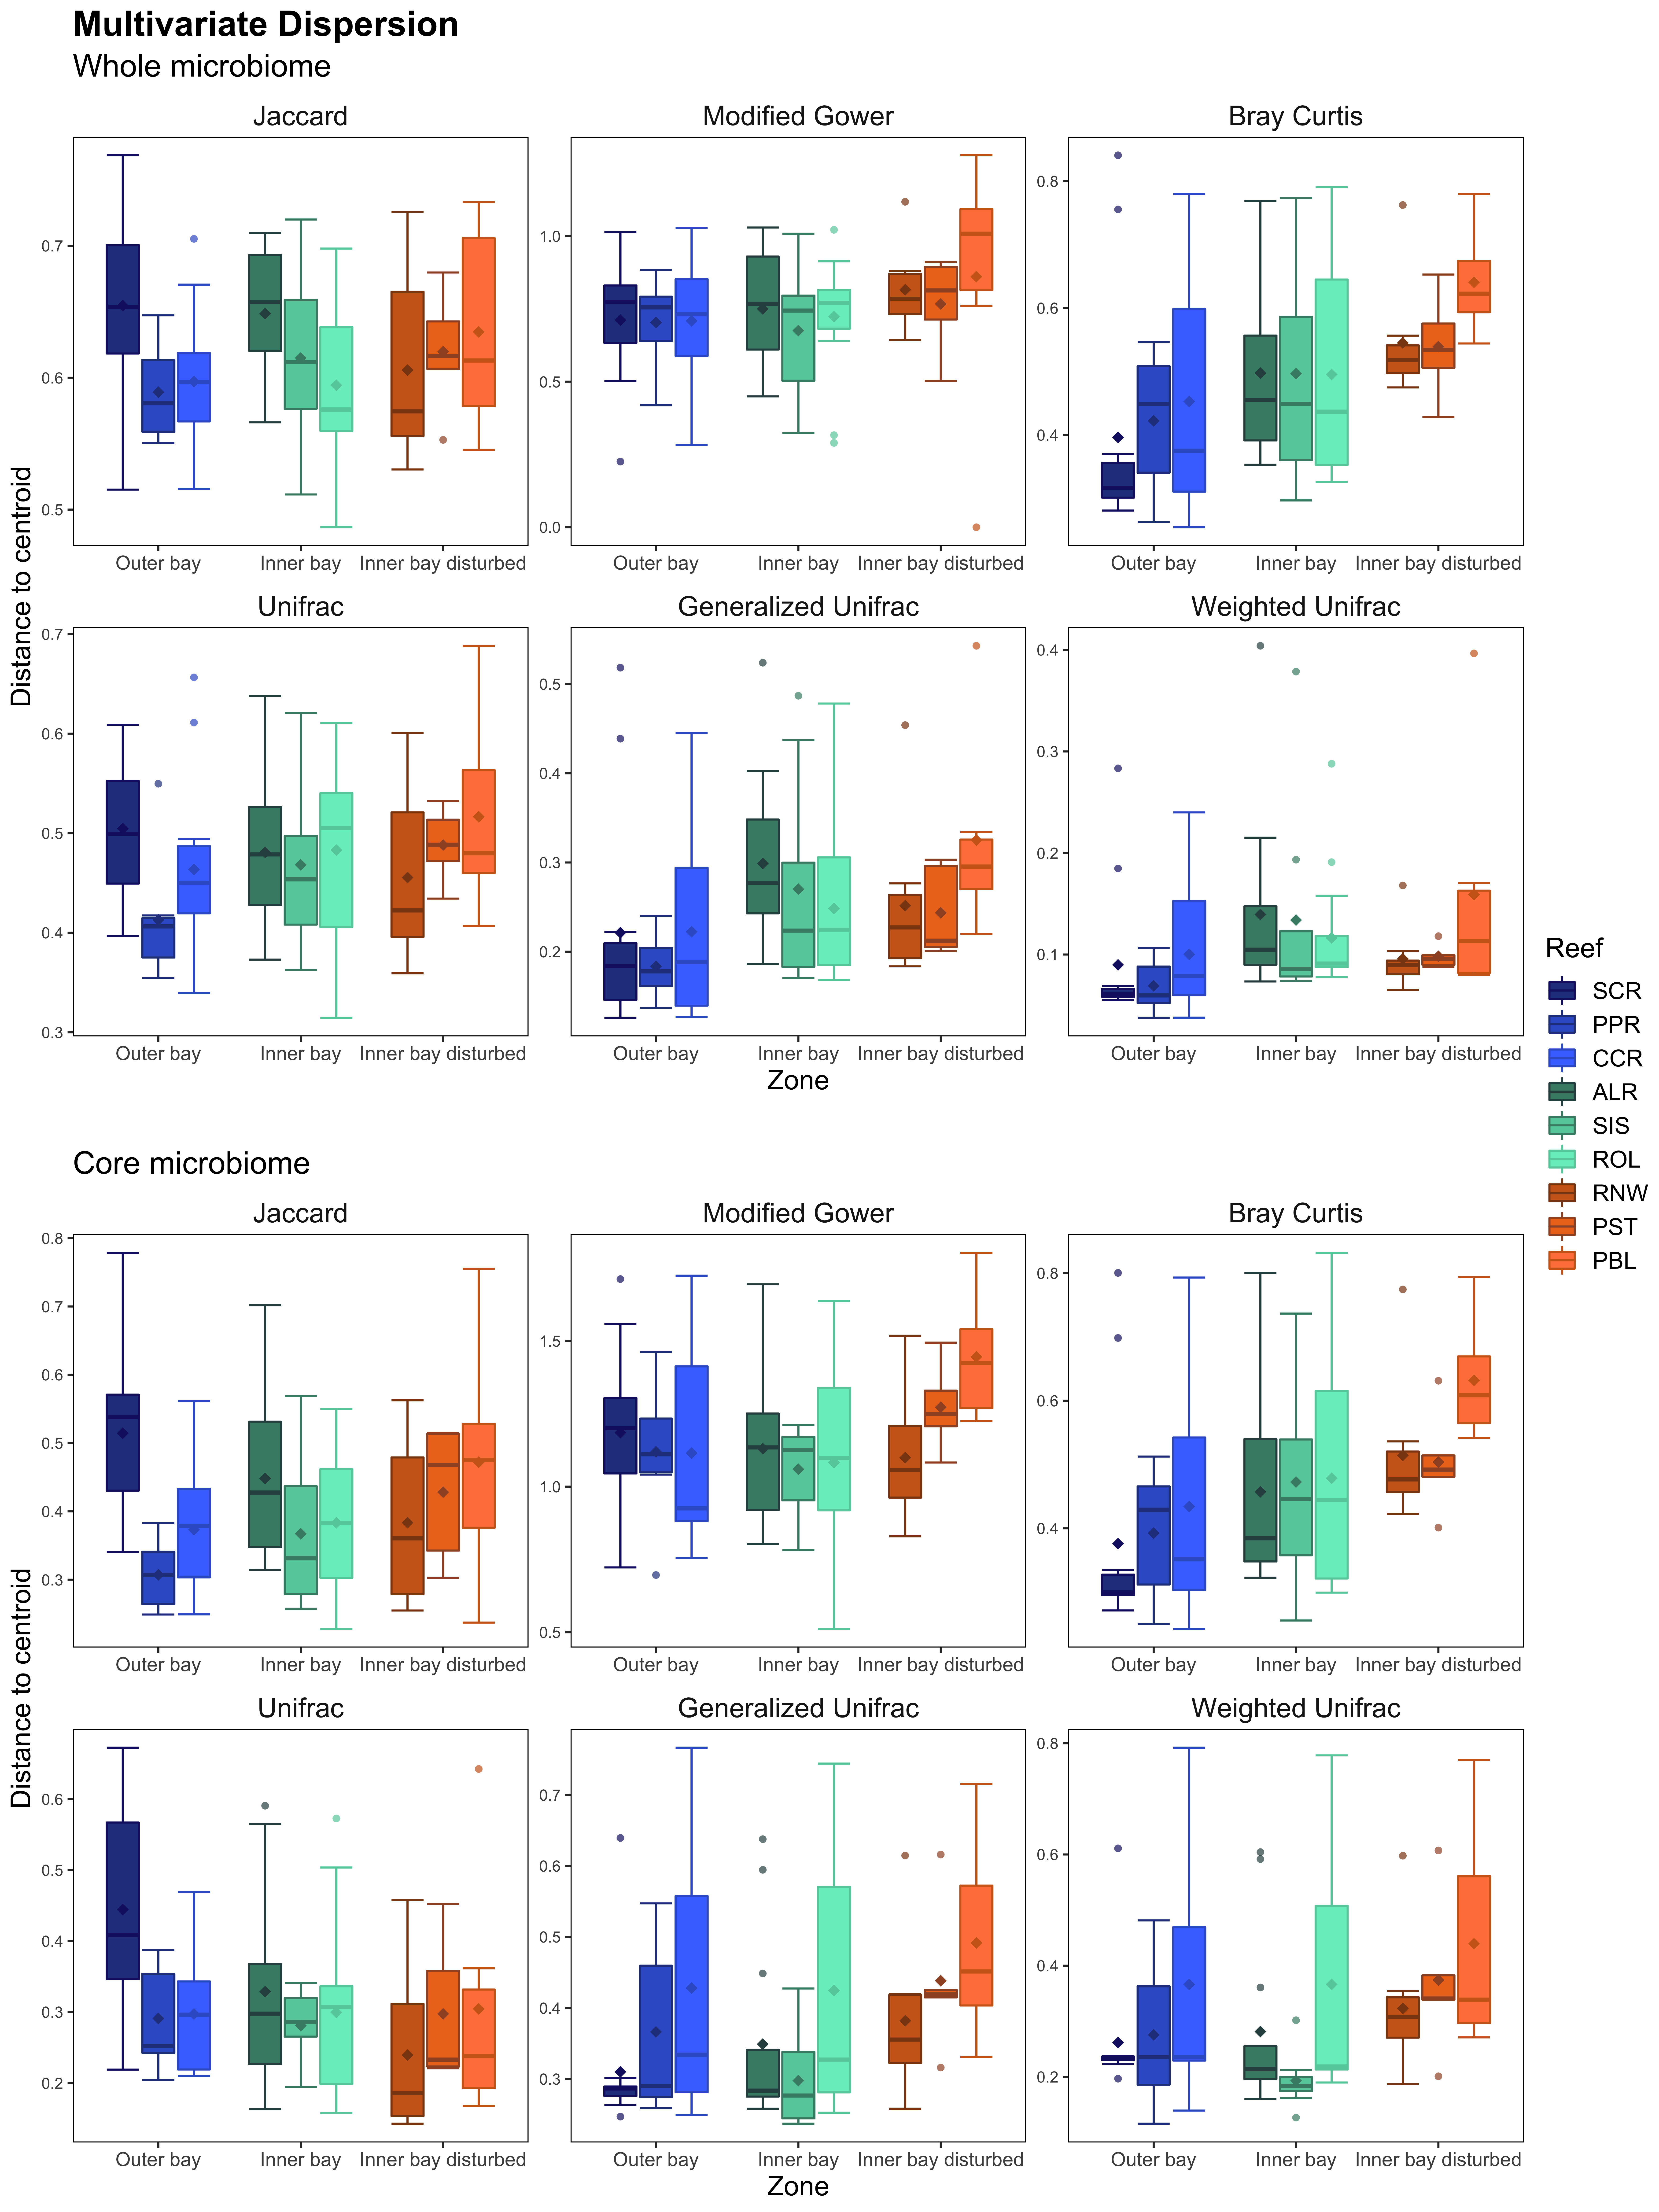
fig4A <-
        ggplot(data = data.all, aes(x = factor(Zone, level = level_order),
                                    y=Distance_to_centroid))+
        stat_boxplot(aes(colour=Reef), geom ='errorbar', alpha=1) +
        geom_boxplot(aes(fill=Reef, colour=Reef), alpha=1,
                     outlier.alpha = 0.7, outlier.shape = 16)+
        scale_colour_manual(values=disp.pal5)+
        scale_fill_manual(values=disp.pal4)+
        ggtitle("Multivariate Dispersion", subtitle="Whole microbiome")+
        theme(plot.title=element_text(size=18, face="bold"))+
        theme(plot.subtitle=element_text(size=16))+
        font_theme+
        stat_summary(aes(fill=Reef), fun="mean", geom="point",
                     size=2.5, shape=18,
                     position=position_dodge(width=0.75),
                     color=c("midnightblue", "royalblue4", "royalblue3",
                             "darkslategrey", "aquamarine4", "mediumaquamarine",
                             "chocolate4", "sienna", "chocolate3",
                             "midnightblue", "royalblue4", "royalblue3",
                             "darkslategrey", "aquamarine4", "mediumaquamarine",
                             "chocolate4", "sienna", "chocolate3", "midnightblue",
                             "royalblue4", "royalblue3","darkslategrey",
                             "aquamarine4", "mediumaquamarine","chocolate4",
                             "sienna", "chocolate3", "midnightblue", "royalblue4",
                             "royalblue3","darkslategrey", "aquamarine4",
                             "mediumaquamarine","chocolate4", "sienna",
                             "chocolate3", "midnightblue", "royalblue4",
                             "royalblue3","darkslategrey", "aquamarine4",
                             "mediumaquamarine","chocolate4", "sienna",
                             "chocolate3","midnightblue", "royalblue4",
                             "royalblue3","darkslategrey", "aquamarine4",
                             "mediumaquamarine","chocolate4", "sienna",
                             "chocolate3"), show.legend = FALSE)+
        scale_x_discrete(name="Zone") +
        scale_y_continuous(name="Distance to centroid")+
        facet_wrap(~factor(Metric, levels=unique(Metric)),
                   scales="free",ncol = 3)+
        theme(strip.background = element_rect(color="black", fill="white",
                                              size=1, linetype="blank"),
              strip.text.x = element_text(size = 14),
              panel.border = element_rect(fill = NA, color="black"),
              panel.grid.major = element_blank(),
              panel.grid.minor = element_blank(),
              panel.background = element_rect(fill = "white",colour = NA),
              legend.key = element_rect(fill = "transparent", color = NA),
              legend.text = element_text(size = 12),
              legend.title = element_text(size = 14))

fig4A
Core community
fig4B <-
        ggplot(data = data.all.core, aes(x = factor(Zone, level = level_order),
                                         y=Distance_to_centroid))+
        stat_boxplot(aes(colour=Reef), geom ='errorbar', alpha=1) +
        geom_boxplot(aes(fill=Reef, colour=Reef), alpha=1,
                     outlier.alpha = 0.7, outlier.shape = 16)+
        scale_colour_manual(values=disp.pal5)+
        scale_fill_manual(values=disp.pal4)+
        ggtitle("", subtitle="Core microbiome")+
        theme(plot.subtitle=element_text(size=16))+
        font_theme+
        stat_summary(aes(fill=Reef), fun="mean", geom="point", size=2.5, shape=18,
                     position=position_dodge(width=0.75),
                     color=c("midnightblue", "royalblue4", "royalblue3",
                             "darkslategrey", "aquamarine4", "mediumaquamarine",
                             "chocolate4", "sienna", "chocolate3","midnightblue",
                             "royalblue4", "royalblue3","darkslategrey",
                             "aquamarine4", "mediumaquamarine","chocolate4",
                             "sienna", "chocolate3","midnightblue", "royalblue4",
                             "royalblue3","darkslategrey", "aquamarine4",
                             "mediumaquamarine","chocolate4", "sienna",
                             "chocolate3","midnightblue", "royalblue4",
                             "royalblue3","darkslategrey", "aquamarine4",
                             "mediumaquamarine","chocolate4", "sienna",
                             "chocolate3", "midnightblue", "royalblue4",
                             "royalblue3","darkslategrey", "aquamarine4",
                             "mediumaquamarine","chocolate4", "sienna",
                             "chocolate3", "midnightblue", "royalblue4",
                             "royalblue3","darkslategrey", "aquamarine4",
                             "mediumaquamarine","chocolate4", "sienna", "chocolate3"),
                     show.legend = FALSE)+
        scale_x_discrete(name="Zone") +
        scale_y_continuous(name = "Distance to centroid") +
        facet_wrap(~factor(Metric, levels=unique(Metric)),scales = "free", ncol = 3) +
        theme(strip.background = element_rect(color="black", fill = "white",
                                              size=1, linetype="blank"),
              strip.text.x = element_text(size = 14),
              panel.border = element_rect(fill = NA, color = "black"),
              panel.grid.major = element_blank(),
              panel.grid.minor = element_blank(),
              panel.background = element_rect(fill = "white",colour = NA),
              legend.key = element_rect(fill = "transparent", color = NA),
              legend.text = element_text(size = 12),
              legend.title = element_text(size = 14))
fig4B
Beta Dispersion Plots Whole v Core

That’s the end of Script 6. In the next Script we use PIME as an additional tool to identify the core fish gut microbiome.
Source Code
The source code for this page can be accessed on GitHub by clicking this link.